Easily plot graphs in your website using Plotly + Python
For the last few days I have been scratching my head. How do you plot all the data in your django website, without having to figure out D3 or any other complicated graphing libraries?
I've looked at several solutions, including Djangos Graphos, Chartit, NVD3… Everyone online seems to be recommending to use charting libraries off of this list: https://djangopackages.org/grids/g/charts/
It's frustrating to try many solutions to find out that they are all too complicated to understand, and the copy+paste approach doesn't work most of the time.
However, one good thing came out of this process. I discovered that Plotly is now open-source! Years ago I once played around with Plotly's graphing library, marveling at it's ease of use and admiring it's beauty, however to use it in the past we had to make our plots public for all to see and store them on Plotly's servers. This limited how I could use Plotly in my projects, but that limit isn't on Plotly anymore. Now we can use Plotly just like any other library in Python, Javascript, and other programming languages.
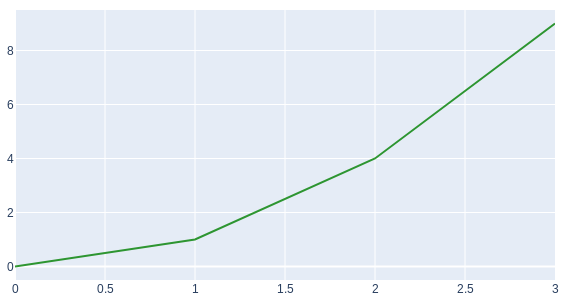
Today I will show you how absolutely easy it is to plot graphs in Django using Plotly's Python API. We are going to make a simple interactive plot that looks like this:
The Basics of plotting with Plotly
To get a simple graph up and rendering in plotly is easy, just 8 lines of code:
1 | from plotly.offline import plot |
Now plt_div holds all the HTML needed to render the plot!
How easy was that?
If you want to quickly see your plot rendering in a web browser, paste the contents of plt_div into an HTML file like so, and then open your HTML file with your browser.
1 | <html> |
Plotting with Plotly + Django
Here is an example Django view and template to display this plot:
views.py
1 | from django.shortcuts import render |
index.html
1 |
|
The above code renders this:
Go ahead and click around on the plot, it’s fully responsive.
I actually added that plot on this page by copying the javascript code that Plotly generated right into the markdown file of this blog post. I modified the code to point to a CDN for plotly.js instead of including the entire plotly.js in the source-code of my blog.
Making the pages load faster
With the above code, the entire plotly javascript library is inside of the generated HTML within plot_div. This makes it simple to get plotly working on the web, since there are no dependancies, however the plots will load faster if you instead manually include plotly.js.
This is the change to plot() that you will need to make:
1 | plt_div = plot(fig, output_type='div', include_plotlyjs=False) |
This is the change to the HTML you will need to make:
1 | <head> |
Another tip:
If you don’t want the link to the plotly website on your graph, you can turn it off with including these options:
1 | plot_div = plot(... , show_link=False, link_text="") |
Conclusion
Plotly is the only graphing library I know of that works the same in Python as it does on the web, meaning I don’t need to make any transformations of the data from a python format to generate the plots. This made it extremely easy for me to get started right away developing visuals for a project I'm working on.
There are no special django plugins to download. No special javascript libraries to learn, no special way to format the data between python and html… everything just works :)
Checkout https://plot.ly for more information on how to make different kinds of plots.
As always, any questions you have leave them in the comments below. I'd be glad to help, and maybe see what kind of projects you are working on.
Comments
<code><pre>insert.code.here()<pre/><code/>