As a Dash developer, I wanted a way to write clean, maintainable code without constantly switching between Python and JavaScript. Writing clientside logic inside a string felt clunky, and I knew there had to be a way to take advantage of quick clientside features of Dash without sacrificing the readability and syntax-highlighting of my code.
Python
2025-02-18
2025-02-15
When building applications with Plotly Dash, it’s not that easy to adhere to Modular Web Design. One common challenge is managing component IDs. Typically, developers define an ID in one place and reference it in another, leading to scattered logic that can be difficult to maintain. Inspired by Dash’s All-in-One Components, I set out to create a more modular approach. This led to the development of dash-basecomponent, a Python package that simplifies component structuring while promoting modular web design.
2024-08-09
Monitoring what happens on your computer can be incredibly useful, whether you’re trying to track your productivity, analyze how you spend your time, or even ensure that certain applications are being used efficiently. Python makes this task approachable and powerful by allowing you to interact directly with the Windows operating system. Let’s dive into the concepts and build a monitoring tool from scratch, step by step, using the interactive Python terminal.
Step 1: Getting the Active Window Title
The first thing we want to do is identify the active window—that is, the window currently in focus on your screen. We’ll use the pywin32 library, which provides a direct interface with Windows APIs. Start by installing the necessary package:
2020-05-20
I am not endorsed in any way by Plaid to share this info, just helping others get a head start on using Plaid with Django.
Plaid is a plaform-as-a-service API which you can use to build your own financial apps. It has features such as easily linking to existing bank accounts, and also auto-categorization of transactions. Plaid’s API brings all the data from different financial sources into one place and one format so you can build apps with a holistic view of a user’s finances.
Ok. Now all praise of Plaid aside, I’m sure you are here because you want to build a Django app that uses Plaid to obtain users’ financial data. In all of Plaid’s tutorials shown in their quickstart github page, they have a tutorial for Python, but it’s using Flask for the backend rather than Django.
I’ve taken the time to translate their tutorial from Flask to Django. The main difference was Django’s requirement of having CSRF protection.
2019-08-28
For the last few days I have been scratching my head. How do you plot all the data in your django website, without having to figure out D3 or any other complicated graphing libraries?
I've looked at several solutions, including Djangos Graphos, Chartit, NVD3… Everyone online seems to be recommending to use charting libraries off of this list: https://djangopackages.org/grids/g/charts/
It's frustrating to try many solutions to find out that they are all too complicated to understand, and the copy+paste approach doesn't work most of the time.
However, one good thing came out of this process. I discovered that Plotly is now open-source! Years ago I once played around with Plotly's graphing library, marveling at it's ease of use and admiring it's beauty, however to use it in the past we had to make our plots public for all to see and store them on Plotly's servers. This limited how I could use Plotly in my projects, but that limit isn't on Plotly anymore. Now we can use Plotly just like any other library in Python, Javascript, and other programming languages.
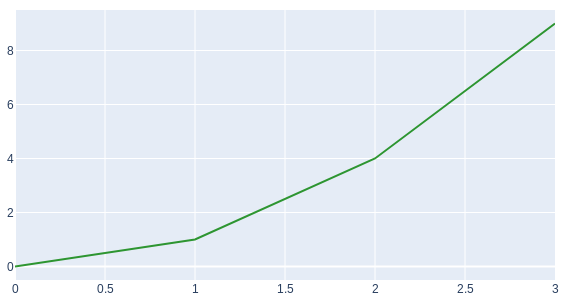
Today I will show you how absolutely easy it is to plot graphs in Django using Plotly's Python API. We are going to make a simple interactive plot that looks like this: